MEDIA
The First 10 Metrics for an AI-Operated Business Command Center
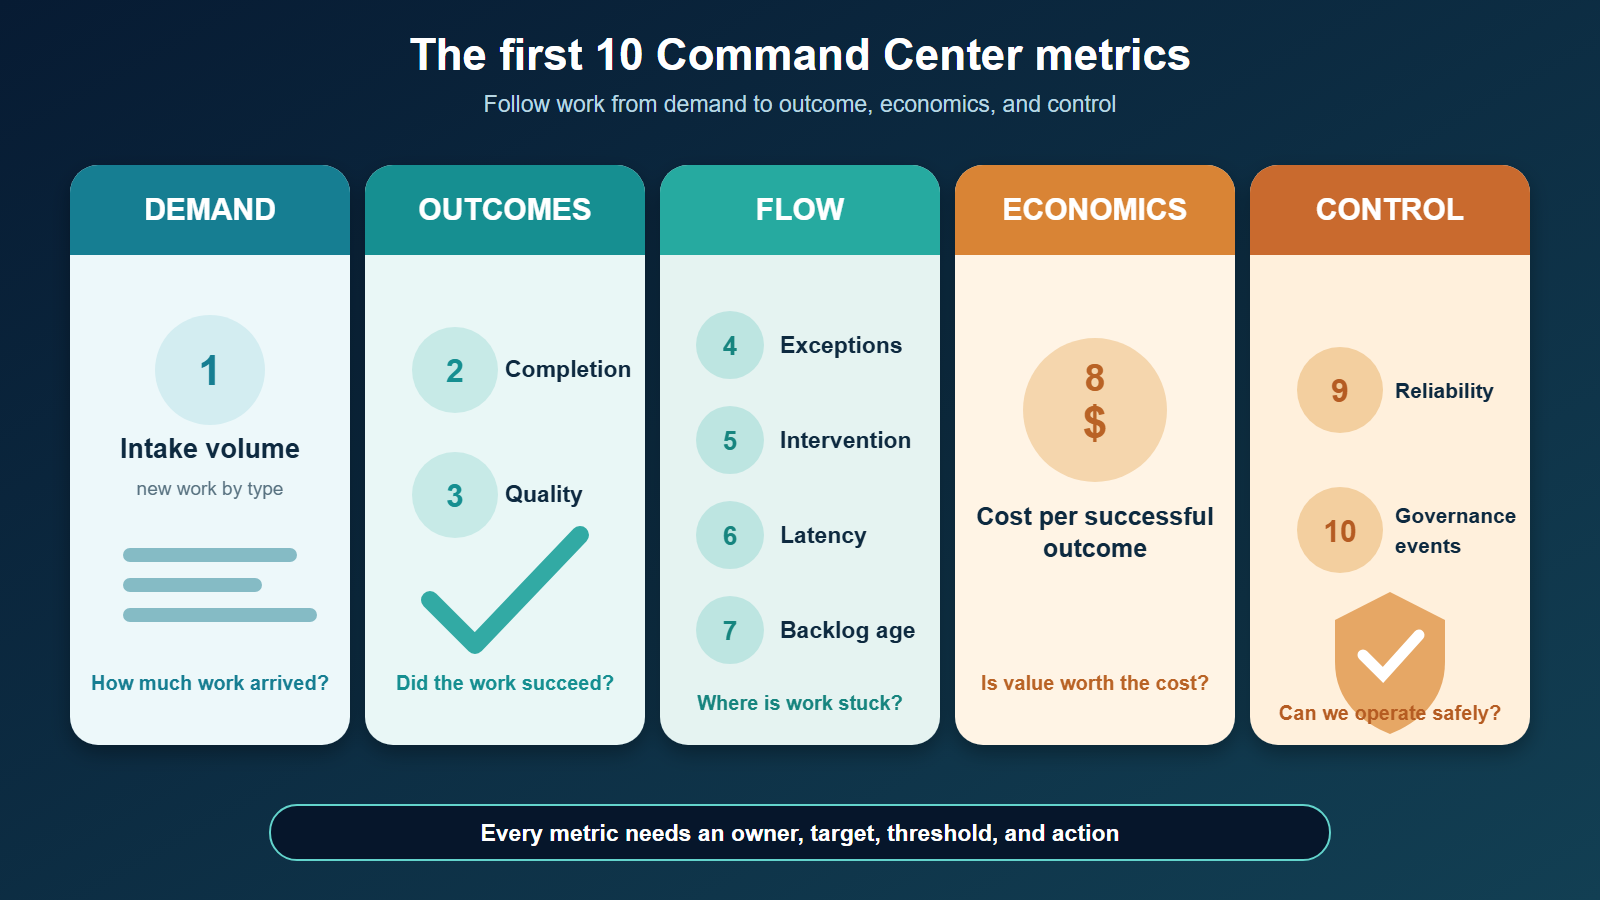
An AI-operated business Command Center should answer three questions at a glance: Is the work producing the intended outcome? Where does a person need to intervene? Is cost and risk staying inside the business’s limits? Start with ten metrics: intake volume, completion rate, outcome quality, exception rate, human intervention, end-to-end latency, backlog age, cost per successful outcome, reliability, and governance events.
These measures connect business results to operational health. They are more useful than a wall of model statistics because they follow a unit of work from arrival through outcome. Model tokens, confidence scores, and tool calls still matter for diagnosis, but they should sit beneath the operating view.

The first ten metrics
1. Intake volume
Definition: Count of new work items received by workflow and time period.
Volume establishes demand and makes every rate interpretable. Break it down by customer, channel, work type, or priority only when that distinction changes an operating decision. A surge is not automatically good or bad; compare it with capacity, quality, and backlog.
Show today’s count, comparison with a useful baseline, and a short trend. Alert when volume leaves the range the workflow was designed to handle.
2. Completion rate
Definition: Successfully completed items divided by eligible items due in the period.
Define “complete” in business terms. An email draft is not complete if the workflow’s purpose is an approved and delivered response. Separate completed, failed, cancelled, waiting, and still within service time so unfinished work does not vanish from the denominator.
3. Outcome quality
Definition: Share of completed items meeting the workflow’s acceptance criteria.
Quality may be an audited accuracy rate, customer resolution, approved deliverable, correctly reconciled transaction, or another task-specific result. Use a reviewed sample when inspecting every item is impractical. Track the sample size and sampling method beside the score.
Avoid a single universal “AI accuracy” number. Quality criteria should match the consequence and purpose of each workflow.
4. Exception rate
Definition: Items leaving the normal path divided by total processed items.
Exceptions include missing data, conflicting policy, unknown request types, unavailable tools, permission blocks, and cases that cross an approval threshold. Categorize them by reason and owner. A rising exception rate may reveal scope creep, poor inputs, changing customer behavior, or a broken integration before the final failure rate moves.
5. Human intervention
Definition: Percentage of items requiring a person, plus human minutes per successful outcome.
Track both frequency and effort. Ten one-minute approvals are different from ten forty-minute investigations. Distinguish planned review from avoidable rescue work. Planned intervention is a control; repeated manual repair is an operating defect.
This metric also prevents “automation” from looking efficient merely because human effort moved into an unmeasured queue.
6. End-to-end latency
Definition: Time from eligible intake to the business finish condition.
Use median and a tail percentile such as the 95th percentile rather than only an average. A fast majority can hide a small group of customers waiting far too long. Split latency into waiting and active processing where possible; faster model responses will not fix a workflow stalled for approval.
Google’s Site Reliability Engineering guidance treats latency as one of four golden signals and recommends distinguishing successful from failed requests. Apply the same discipline to business workflows.
7. Backlog and oldest-item age
Definition: Number of eligible items waiting, with the age of the oldest item.
Backlog is the business equivalent of saturation: it shows demand approaching or exceeding capacity. A count alone can look stable while one difficult case is ignored for weeks. Pair it with aging bands and the oldest-item age.
Assign every queue an owner and service expectation. A Command Center should make ownerless or blocked work conspicuous.
8. Cost per successful outcome
Definition: Allocated fixed and variable operating cost divided by successful outcomes.
Include model and tool usage, automation tasks, infrastructure, monitoring, human review, and maintenance. Do not divide by attempted runs; retries and rejected outputs still cost money. The AI agent business cost model explains the full stack.
Compare cost with the prior process and the value of the result. Cheapest is not best if quality or reliability falls.
9. Reliability
Definition: Share of eligible runs that finish without unplanned failure, duplicate action, timeout, or manual recovery.
Display failure and retry counts beside the rate. Also track time to detect and time to recover from material incidents. A workflow that succeeds after five hidden retries may appear reliable while generating delay, cost, and duplicate-action risk.
Use synthetic checks for critical paths and maintain the reliable automation cycle. NIST recommends monitoring deployed AI performance, incidents, downtime, and response time under real operating conditions.
10. Governance and safety events
Definition: Count and severity of permission blocks, policy conflicts, unsupported claims, privacy incidents, unsafe outputs, unapproved actions, and other control events.
Separate controls that worked from controls that failed. A blocked unauthorized request is evidence of exposure and of a functioning guardrail; an unblocked unauthorized action is an incident. Review trends by workflow, source, and control.
Do not compress all events into a comforting green score. Show the serious cases, owner, status, and required decision.
A compact operating view
| Area | Headline metrics | The decision it supports |
|---|---|---|
| Demand | intake volume | Do we need to change capacity or scope? |
| Outcomes | completion and quality | Is the workflow delivering its purpose? |
| Flow | exceptions, intervention, latency, backlog | Where is work slowing or escaping the normal path? |
| Economics | cost per successful outcome | Is the system creating value at an acceptable cost? |
| Control | reliability and governance events | Can the business keep operating safely? |
Show the ten headline numbers on one page with time range, workflow filter, owner, target, current value, trend, and status. Link each card to the queue, incident, source evidence, or diagnostic breakdown that explains it. The dashboard is an index into operating work, not a slide to admire.
Make the metric data trustworthy
The Command Center is only as dependable as its event definitions. Give every work item a stable identifier and record its intake time, workflow, customer or business scope, state transitions, finish condition, exception reason, human touches, costs, and outcome evidence. Use code to calculate fixed counts, durations, rates, and thresholds; reserve models for clearly identified judgment tasks such as classifying an unusual exception or reviewing a sampled output.
Reconcile dashboard totals with source systems on a schedule. Look for missing events, duplicate records, time-zone errors, late-arriving updates, and status names that changed after a workflow release. Display the data’s latest refresh time and flag incomplete periods rather than presenting a partial day as a sudden performance collapse.
Version metric definitions. If “successful completion” changes, mark the date and avoid pretending the before-and-after values are directly comparable. Keep raw operational events separate from derived dashboard measures so the business can recalculate a rate, investigate an incident, or correct a faulty rule without rewriting history.
Finally, test the dashboard itself. Seed known work items through success, exception, failure, and recovery paths and verify that each appears in the right metric exactly once. A monitoring system that silently misses a failure creates false confidence.
Choose targets before alerts
For each metric, record:
- a precise definition and data source;
- the owner responsible for response;
- target, warning, and critical thresholds;
- the comparison period;
- known exclusions or data delays; and
- the action expected when a threshold is crossed.
Alert only when a person must act with reasonable urgency. Google SRE warns that noisy alerts train people to skim or ignore the important signal. Put trends and nonurgent degradation on the dashboard or in a review queue; reserve interruptions for user-visible failure, imminent capacity loss, or material control breaches.
Use three operating cadences
Real time: Watch critical failures, permission breaches, queue saturation, and work that has exceeded a service limit.
Weekly: Review outcomes, exceptions, human effort, cost, and the oldest unresolved work. Assign corrective actions and owners.
Monthly: Revisit targets, compare value with cost, analyze incidents and drift, retire weak metrics, and decide whether to expand, constrain, redesign, or stop a workflow.
The same number can support different decisions at different cadences. A single slow case may need immediate help; a month-long increase in tail latency may require process redesign.
What not to put at the top
Avoid leading with tokens, prompt length, model confidence, number of agents, or total tool calls. They are useful diagnostic or cost drivers, not proof of business performance. Also avoid vanity totals that always rise, unowned metrics, and composite “health” scores that conceal a severe failure.
The Command Center should preserve the trail from business outcome to operational cause. Start with the ten metrics, then add a measure only when it supports a named decision.
Sources and further reading
Operate outcomes, not dashboards
A Command Center earns its place when it shortens the distance between a signal and a responsible action. Ten well-defined measures with owners and thresholds are more valuable than hundreds of charts no one uses.
Agentrepreneur: Building Your AI Agent Business in 28 Days goes deeper into the operating structure behind an agent-enabled company. This article defines the first measurement layer without reproducing the book’s implementation.
Continue with What Should Appear on a Weekly AI Operations Report? and How to Audit Old Automations Before They Break, or return to the AI Operations & Command Centers hub.